
The only gods we trust with our CUDA kernels.
SLURM in the Wild: A Practical Guide for Academic Labs
A complete guide from basic concepts to academic deployment, covering multi-node setup, GPU scheduling, advanced monitoring, and the hard-learned lessons from scaling a research lab from 2 to 30+ users across heterogeneous hardware.
Table of Contents
- 1. How We Improved Our Infrastructure
- 2. Understanding SLURM Core Concepts
- 3. Installation and Basic Setup
- 4. Multi-Node Setup and Authentication
- 5. Configuration Files Deep Dive
- 6. Quality of Service Policies
- 7. Advanced Monitoring and Analytics
- 8. Real-World Usage Examples
- 9. Troubleshooting and Maintenance
- 10. Interactive HTML Reports
- 11. Conclusion
- 12. Comments
Note: All configuration files and scripts mentioned in this guide are available in this GitHub repository.
How We Improved Our Infrastructure
When I joined the SARDINE Lab in 2018–2019 (called DeepSPIN at the time), our computing infrastructure was refreshingly simple: two machines with 4× GTX 1080 GPUs each, supporting a tight-knit group of 5 PhD students and 2 postdocs. For the NLP research we were doing at the time, this setup was more than adequate.
Our resource allocation system was equally simple: a shared Google Spreadsheet where researchers would claim GPUs for their experiments. It worked well enough, except during those frenzied pre-deadline periods when everyone suddenly needed to run "large-scale" experiments simultaneously. The spreadsheet would become a battlefield of merged cells and conflicting claims, but we survived those chaotic moments through informal Slack negotiations and good-natured compromise.
Fast-forward to today: our lab has grown to around 30 active researchers across 9 physically distributed servers featuring different GPU architectures—from older GTX cards to modern H100s and H200s. What started as manageable chaos had become completely unworkable. The spreadsheet method simply doesn't scale when you have dozens of users competing for resources across heterogeneous hardware. We were losing precious compute cycles to forgotten reservations, experiencing frequent conflicts over GPU access, and had no way to track actual resource utilization or ensure fair allocation.
After evaluating various options, we decided to implement SLURM. While initially an unpopular decision among some lab members who preferred the "freedom" of manual coordination, it has proven transformative. Now researchers submit jobs to intelligent queues that automatically allocate resources based on availability and priority. We have complete visibility into usage patterns, fair resource distribution, and the peace of mind that comes from professional job scheduling.
However, I won't sugarcoat the journey… Setting up SLURM is notoriously challenging. The documentation is dense, configuration files are numerous and interdependent, and examples for research lab environments (as opposed to traditional HPC centers) are scarce. Multi-node GPU clusters add another layer of complexity that can feel like navigating uncharted territory.
This guide documents my real-world experience building a production SLURM cluster for academic research. Rather than jumping straight into configuration files, I'll start with the essential concepts that make SLURM tick. Understanding these fundamentals will make the subsequent setup much more intuitive and help you troubleshoot issues when they inevitably arise.
Understanding SLURM Core Concepts
Before diving into installation, you need to understand SLURM's key concepts. Think of SLURM as an intelligent resource broker that sits between users and hardware, making decisions about who gets what resources and when. The magic happens through three core concepts that work together: cgroups for isolation, partitions for organization, and Quality of Service (QoS) for fairness.
Cgroups: The Foundation of Resource Control
The first thing to understand is that SLURM doesn't just schedule jobs, it can also enforce resource limits. This is extremely useful, because without proper enforcement, a user requesting 1 GPU could accidentally (or intentionally) use all GPUs on a node, completely defeating the purpose of scheduling. This is where Linux control groups (cgroups) come in. Cgroups are Linux kernel features that isolate and limit resource usage for groups of processes. SLURM uses them to create "containers" around jobs, ensuring they can only access the CPU cores, memory, and devices they were allocated.
Setting up cgroups requires both kernel configuration and SLURM configuration. First, we need to enable the right kernel parameters in /etc/default/grub:
# Add cgroup options to kernel command line
GRUB_CMDLINE_LINUX="cgroup_enable=memory systemd.unified_cgroup_hierarchy=0"
sudo update-grub
sudo reboot
Then configure SLURM to use cgroups for resource control by editing (or creating if it does not exist) the file /etc/slurm/cgroup.conf:
CgroupAutomount=yes
ConstrainCores=yes       # Limit CPU cores
ConstrainRAMSpace=yes    # Limit memory usage
ConstrainDevices=yes     # Control device access
And the specific devices that jobs are allowed to access in /etc/slurm/cgroup_allowed_devices_file.conf:
/dev/null
/dev/urandom
/dev/zero
/dev/sda*
/dev/cpu/*/*
/dev/pts/*
/dev/nvidia*    # Allow GPU access
Partitions: Organizing Your Hardware
Once you have resource enforcement working, you need to organize your hardware logically. SLURM partitions are like job queues, but more powerful. They group nodes with similar characteristics and can have different policies, priorities, and access controls.
In our lab, we organize partitions primarily by GPU type, since that's usually the limiting factor for our workloads. This allows researchers to request specific hardware for their experiments: sbatch --partition=h100 my_large_model_job.sh ensures the job runs on our high-memory H100 nodes, while --partition=a6000 targets our more numerous A6000 nodes for less intensive training runs.
Quality of Service: The Art of Fair Scheduling
Here's where SLURM gets really interesting. Quality of Service (QoS) policies are templates that define resource limits, priorities, and time constraints. But they're much more than simple quotas—they're tools for shaping user behavior and encouraging efficient resource usage.
The key insight is that good QoS design creates incentive alignment. Short jobs get high priority and generous resource limits, encouraging users to break large experiments into smaller pieces when possible. Long jobs get lower priority but extended time limits, ensuring important work can still complete. Emergency QoS levels provide escape hatches for urgent deadlines. We will talk more about Partitions and QoSs later.
The SLURM Ecosystem
SLURM's architecture is elegantly simple yet powerful. At its core, you have slurmd daemons running on each compute node, communicating with a central slurmctld daemon on the management node. For a project like ours, you'll also run slurmdbd for accounting and historical data. The figure below illustrates how each daemon interacts with each other.
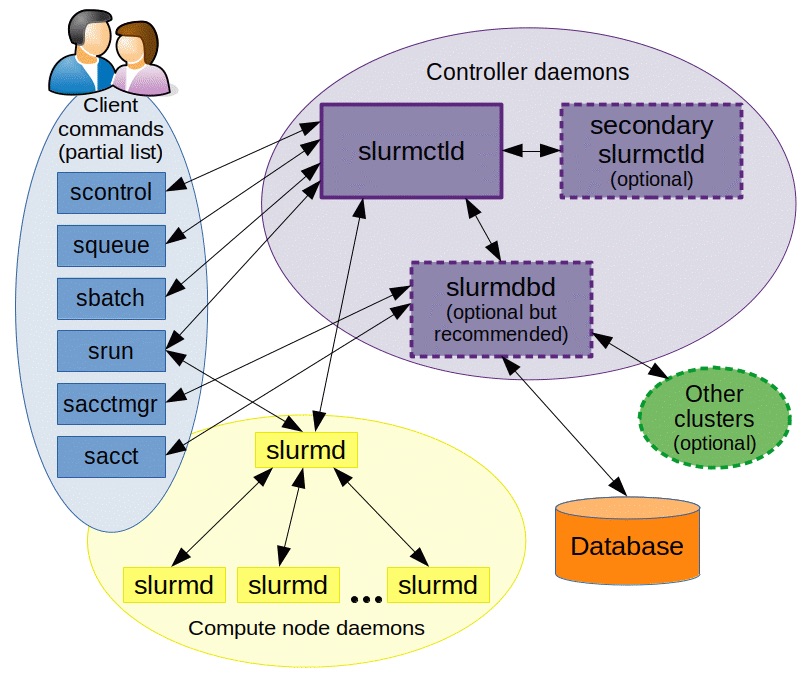
SLURM provides a comprehensive set of commands, but in practice, you'll use a core set regularly. Understanding these commands and their purposes will make the subsequent configuration much clearer:
Job Submission
- sbatch: Submit batch jobs
- srun: Interactive job execution
- salloc: Allocate resources
- scancel: Cancel jobs
Monitoring
- squeue: Job queue
- sinfo: Partition information
- sacct: Job usage history
- scontrol: Administrative control
Management
- sacctmgr: Account management
- sprio: Job priority analysis
- sreport: Usage reports
Before installing SLURM, you may want to consider which plugins you will need for your installation. Refer to the list of possible plugins
here.
In this guide, we will use two plugins: cgroups for resource enforcement and munge for authentication.
Installation and Basic Setup
Now that you understand the concepts, let's build the actual system. My recommendation is to start simple: set up a single controller node that also runs compute jobs, get that working perfectly, then add additional compute nodes. This incremental approach makes debugging much easier. Plan for 2–4 hours for initial setup and testing. SLURM has many interdependent components, and rushing through the installation often leads to hard-to-debug authentication and configuration issues.
Prerequisites and Planning
Before installing anything, ensure your environment meets the basic requirements. It's important that all nodes use the same Linux kernel and OS version. I recommend using Ubuntu with an LTS version (e.g., 22.04 LTS). At this point, we should have NVIDIA GPU drivers installed already. More critically, you need consistent user management across nodes. That is, all users should have the same UID and GID in /etc/passwd, including slurm-related accounts such as munge and slurm. Otherwise, authentication will fail in mysterious ways.
Server Organization
To make this guide more concrete, let's pretend we have a setup with 3 servers (with Ancient Greek God names, of course) in 2 different physical locations:
Location A
-
🏹artemis compute controller
8× A6000 (46 GB)
-
🍇dionysus compute
4× H100 (80 GB)
Location B
-
🔥hades compute
8× H200 (140 GB)
All servers are compute nodes since all of them have GPUs to run jobs. However, we need to select one of them to be a controller node. In our case, it's artemis.
Controller Node Installation
The controller node runs the central scheduling daemon (slurmctld), the accounting database daemon (slurmdbd), and typically a compute daemon (slurmd) if it also runs jobs. Start by installing all the necessary packages:
# Update system and install SLURM components
sudo apt update && sudo apt upgrade -y
sudo apt install slurmd slurmctld slurm-client slurmdbd mariadb-server munge

# Install additional tools
sudo apt install mailutils  # For SLURM notifications
sudo systemctl enable slurmd slurmctld slurmdbd munge

# Additional packages
sudo apt install build-essential libpam0g-dev libmariadb-client-lgpl-dev libmysqlclient-dev mariadb-server libssl-dev
Next, configure MariaDB for SLURM's accounting database. This database tracks every job, resource allocation, and usage metric—it's essential for QoS enforcement and reporting.
sudo systemctl enable mysql
sudo systemctl start mysql
sudo mysql -u root
CREATE DATABASE slurm_acct_db;
CREATE USER 'slurm'@'localhost';
SET PASSWORD FOR 'slurm'@'localhost' = PASSWORD('slurmdbpass');
GRANT USAGE ON *.* TO 'slurm'@'localhost';
GRANT ALL PRIVILEGES ON slurm_acct_db.* TO 'slurm'@'localhost';
FLUSH PRIVILEGES;
EXIT;
Ideally you want to change the password to something different than "slurmdbpass". We will set the same password later in /etc/slurm/slurmdbd.conf.
Database Performance Tuning
For busy clusters with hundreds of daily jobs, the default MariaDB configuration becomes a bottleneck. The accounting database handles constant writes as jobs start and finish, plus reads for priority calculations and reporting. Optimizing these settings can dramatically improve responsiveness:
# Optimizations for SLURM accounting database
innodb_buffer_pool_size=80G      # 50-80% of RAM
innodb_log_file_size=512M        # Larger for write-heavy workloads
innodb_lock_wait_timeout=900     # Longer timeouts for batch operations
Database configuration changes require a restart and may need log file recreation:
sudo systemctl stop mariadb
sudo rm /var/lib/mysql/ib_logfile?  # Remove old log files
sudo systemctl start mariadb
Compute Nodes Installation
Compute nodes are simpler: they only need the compute daemon and authentication. So, on each compute node, run:
sudo apt update
sudo apt install slurmd slurm-client munge
sudo systemctl enable slurmd munge
Multi-Node Setup and Authentication
Single-node SLURM is relatively straightforward, but multi-node deployments introduce authentication complexity that can be frustrating to debug. The key is understanding that SLURM components need to authenticate with each other constantly: the controller talks to compute nodes, nodes report back to the controller, and the database tracks everything.
Munge: The Authentication Backbone
SLURM uses Munge, and so each message between SLURM daemons gets signed with a shared secret key, ensuring that only authorized processes can communicate.
The setup process requires careful attention to file permissions and user synchronization. First, install and configure Munge on all nodes:
# Controller node
sudo apt-get install libmunge-dev libmunge2 munge -y
sudo systemctl enable munge
sudo systemctl start munge

# Compute nodes
sudo apt-get install libmunge-dev libmunge2 munge -y
The critical step is distributing the Munge key. This shared secret must be identical on all nodes:
# Copy key from controller to all compute nodes
sudo scp -p /etc/munge/munge.key username@compute-node:/etc/munge/munge.key

# Set proper permissions on all nodes (this is crucial!)
sudo chown -R munge: /etc/munge/ /var/log/munge/
sudo chmod 0700 /etc/munge/ /var/log/munge/
⚠️ Warning: Incorrect file permissions are the most common cause of Munge authentication failures. The munge.key file must be readable only by the munge user, and the directories must have the exact permissions shown above.
For busy clusters, optimize Munge threading to handle the authentication load. For that, increase the number of threads in /etc/default/munge:
OPTIONS="--num-threads 10"Then, restart munge on all nodes:
sudo systemctl daemon-reload
sudo systemctl restart munge
Always test Munge authentication before proceeding:
# Test munge on each node
munge -n | unmunge
# Should show "STATUS: Success (0)"

# Test cross-node authentication
ssh compute-node "munge -n" | unmunge
User and Group Synchronization
Here's where many SLURM deployments fail: user and group IDs must be synchronized across all nodes. When the controller tells a compute node to run a job as user ID 1001, that ID must refer to the same user on both machines. More subtly, the munge and slurm system users must also have consistent IDs.
# Check current UIDs/GIDs on controller
sudo cat /etc/passwd | grep -P "slurm|munge"
# Example output:
# munge:x:64029:64029::/nonexistent:/usr/sbin/nologin
# slurm:x:64030:64030:,,,:/home/slurm:/bin/bash

# Synchronize on compute nodes (if needed)
sudo usermod -u 64029 munge
sudo groupmod -g 64029 munge
sudo usermod -u 64030 slurm
sudo groupmod -g 64030 slurm
Network Configuration
SLURM components communicate over specific TCP/UDP ports. In a trusted internal network, the simplest approach is to allow all traffic between cluster nodes:
# Open required ports on all nodes
sudo ufw allow 6817/tcp  # slurmctld
sudo ufw allow 6817/udp
sudo ufw allow 6818/tcp  # slurmd
sudo ufw allow 6818/udp
sudo ufw allow 6819/tcp  # slurmdbd
Alternatively, you can allow all traffic between specific nodes:
sudo ufw allow from NODE_IP
Configuration Files Deep Dive
/etc/slurm/cgroup.conf(all nodes)/etc/slurm/cgroup_allowed_devices_file.conf(all nodes)/etc/slurm/slurmdbd.conf(controller only)/etc/slurm/gres.conf(all nodes)/etc/slurm/slurm.conf(all nodes)
See repo: github.com/mtreviso/slurm-setup
SLURM's behavior is controlled by several interconnected configuration files, and getting these right is crucial for a successful deployment. The main configuration file, slurm.conf, must be identical on all nodes (any mismatch will cause nodes to appear as "drained" and refuse to accept jobs). Before that, we will define how many GPUs we have available and from which type.
Database Configuration: slurmdbd.conf
The database configuration is only needed on the controller node and requires careful attention to security:
# === DATABASE CONNECTION ===
AuthType=auth/munge
DbdHost=localhost
StorageHost=localhost
StorageLoc=slurm_acct_db
StoragePass=slurmdbpass
StorageType=accounting_storage/mysql
StorageUser=slurm
SlurmUser=slurm

# === LOGGING ===
LogFile=/var/log/slurm/slurmdbd.log
PidFile=/run/slurmdbd.pid
Afterwards, make sure the file has the correct permissions:
sudo chmod 600 /etc/slurm/slurmdbd.conf
sudo chown slurm:slurm /etc/slurm/slurmdbd.conf
GPU Resource Mapping: gres.conf
This file maps physical GPU devices to SLURM resources and must be created on all nodes:
# === GPU RESOURCE MAPPING ===
# Maps physical /dev/nvidia* devices to SLURM GPU resources

# Artemis node - A6000 GPUs
NodeName=artemis Type=a6000 Name=gpu File=/dev/nvidia0
NodeName=artemis Type=a6000 Name=gpu File=/dev/nvidia1
NodeName=artemis Type=a6000 Name=gpu File=/dev/nvidia2
NodeName=artemis Type=a6000 Name=gpu File=/dev/nvidia3
NodeName=artemis Type=a6000 Name=gpu File=/dev/nvidia4
NodeName=artemis Type=a6000 Name=gpu File=/dev/nvidia5
NodeName=artemis Type=a6000 Name=gpu File=/dev/nvidia6
NodeName=artemis Type=a6000 Name=gpu File=/dev/nvidia7

# Dionysus node - H100 GPUs
NodeName=dionysus Type=h100 Name=gpu File=/dev/nvidia0
NodeName=dionysus Type=h100 Name=gpu File=/dev/nvidia1
NodeName=dionysus Type=h100 Name=gpu File=/dev/nvidia2
NodeName=dionysus Type=h100 Name=gpu File=/dev/nvidia3

# Hades node - H200 GPUs
NodeName=hades Type=h200 Name=gpu File=/dev/nvidia0
NodeName=hades Type=h200 Name=gpu File=/dev/nvidia1
NodeName=hades Type=h200 Name=gpu File=/dev/nvidia2
NodeName=hades Type=h200 Name=gpu File=/dev/nvidia3
NodeName=hades Type=h200 Name=gpu File=/dev/nvidia4
NodeName=hades Type=h200 Name=gpu File=/dev/nvidia5
NodeName=hades Type=h200 Name=gpu File=/dev/nvidia6
NodeName=hades Type=h200 Name=gpu File=/dev/nvidia7
Primary Configuration: slurm.conf
Let's build the main configuration file section by section. This file defines your entire cluster topology, scheduling policies, and resource management settings:
# === CLUSTER IDENTIFICATION ===
ClusterName=sardine-cluster
SlurmctldHost=artemis  # Your controller hostname
MpiDefault=none

# === SLURM CONFIG ===
ReturnToService=1
SlurmctldPidFile=/run/slurmctld.pid
SlurmctldPort=6817
SlurmdPidFile=/run/slurmd.pid
SlurmdPort=6818
SlurmdSpoolDir=/var/lib/slurm/slurmd
SlurmUser=slurm
SlurmctldDebug=info
SlurmctldLogFile=/var/log/slurm/slurmctld.log
SlurmdDebug=debug2
SlurmdLogFile=/var/log/slurm/slurmd.log
StateSaveLocation=/var/lib/slurm/slurmctld
SwitchType=switch/none

# === TIMERS ===
InactiveLimit=0
KillWait=30
MinJobAge=300
SlurmctldTimeout=120
SlurmdTimeout=300
Waittime=0

# === RESOURCE MANAGEMENT ===
GresTypes=gpu                     # Enable GPU tracking
ProctrackType=proctrack/cgroup    # Use cgroups for process tracking
TaskPlugin=task/affinity,task/cgroup  # Enable cgroup

# === SCHEDULING ===
SchedulerType=sched/backfill        # Fill gaps with smaller jobs
SelectType=select/cons_tres         # Track individual resources
SelectTypeParameters=CR_CPU_Memory  # Consumable resources

# === JOB PRIORITY ===
PriorityType=priority/multifactor
PriorityWeightAge=10000           # Jobs gain priority over time
PriorityWeightQOS=250000          # QoS has high impact on priority

# === ACCOUNTING AND LIMITS ===
AccountingStorageEnforce=limits,qos
AccountingStorageType=accounting_storage/slurmdbd
AccountingStorageHost=artemis
AccountingStorageUser=slurm
AccountingStoreFlags=job_comment
AccountingStorageTRES=gres/gpu,gres/gpu:a6000,gres/gpu:h100,gres/gpu:h200

# === JOB OPTIONS ===
JobCompType=jobcomp/none
JobAcctGatherFrequency=30
JobAcctGatherType=jobacct_gather/none

# === COMPUTE NODES ===
NodeName=artemis  CPUs=112 Boards=1 SocketsPerBoard=2 CoresPerSocket=28 ThreadsPerCore=2 RealMemory=1031696 Gres=gpu:a6000:8
NodeName=dionysus CPUs=96  Boards=1 SocketsPerBoard=2 CoresPerSocket=24 ThreadsPerCore=2 RealMemory=1031564 Gres=gpu:h100:4
NodeName=hades    CPUs=192 Boards=1 SocketsPerBoard=2 CoresPerSocket=48 ThreadsPerCore=2 RealMemory=2063731 Gres=gpu:h200:8

# === PARTITIONS ===
PartitionName=a6000 Nodes=artemis  Default=NO MaxTime=INFINITE State=UP OverSubscribe=YES DefCpuPerGPU=8 DefMemPerCPU=12800 DefMemPerGPU=102400 AllowQos=cpu,gpu-debug,gpu-short,gpu-medium,gpu-long
PartitionName=h100  Nodes=dionysus Default=NO MaxTime=INFINITE State=UP OverSubscribe=YES DefCpuPerGPU=8 DefMemPerCPU=21550 DefMemPerGPU=172400 AllowQos=cpu,gpu-debug,gpu-short,gpu-h100
PartitionName=h200  Nodes=hades    Default=NO MaxTime=INFINITE State=UP OverSubscribe=YES DefCpuPerGPU=8 DefMemPerCPU=21550 DefMemPerGPU=172400 AllowQos=cpu,gpu-debug,gpu-short,gpu-h200
There are many options in this file. I removed many commented options for the sake of clarity. Check out the original file to see all commented options: github.com/mtreviso/slurm-setup. Let's dive into some of the most important options.
Node and Partition Definitions
Hardware specifications in SLURM must match reality exactly, or nodes will enter drained state. Use sudo slurmd -C on each node to get accurate specifications:
# On each node
sudo slurmd -C
As output, you may obtain something like NodeName=artemis CPUs=112 Boards=1 SocketsPerBoard=2 CoresPerSocket=28 ThreadsPerCore=2 RealMemory=1031696.
Copy the output and paste it as the node definition, then append the Gres information (which GPU types and how many — these must match what you defined in gres.conf).
# === NODE DEFINITIONS ===
NodeName=artemis  CPUs=112 Boards=1 SocketsPerBoard=2 CoresPerSocket=28 ThreadsPerCore=2 RealMemory=1031696 Gres=gpu:a6000:8
NodeName=dionysus CPUs=96  Boards=1 SocketsPerBoard=2 CoresPerSocket=24 ThreadsPerCore=2 RealMemory=1031564 Gres=gpu:h100:4
NodeName=hades    CPUs=192 Boards=1 SocketsPerBoard=2 CoresPerSocket=48 ThreadsPerCore=2 RealMemory=2063731 Gres=gpu:h200:8
Once we have the node definitions, we can create our partitions. Three key parameters:
DefCpuPerGPU: default number of CPUs per GPU — choose a reasonable number that leaves a few cores for the OS.DefMemPerGPU: default RAM per GPU — similarly, leave some headroom for OS processes.AllowQos: which QoS levels can be used in that partition. You can always edit this later and restart services.
# === PARTITIONS ===
PartitionName=a6000 Nodes=artemis  Default=NO MaxTime=INFINITE \
    State=UP OverSubscribe=YES DefCpuPerGPU=8 DefMemPerGPU=102400 \
    AllowQos=cpu,gpu-debug,gpu-short,gpu-medium,gpu-long

PartitionName=h100  Nodes=dionysus Default=NO MaxTime=INFINITE \
    State=UP OverSubscribe=YES DefCpuPerGPU=8 DefMemPerGPU=172400 \
    AllowQos=cpu,gpu-debug,gpu-short,gpu-h100

PartitionName=h200  Nodes=hades    Default=NO MaxTime=INFINITE \
    State=UP OverSubscribe=YES DefCpuPerGPU=8 DefMemPerGPU=172400 \
    AllowQos=cpu,gpu-debug,gpu-short,gpu-h200
So, DefCpuPerGPU=8 automatically allocates 8 CPU cores for each GPU requested, while DefMemPerGPU=102400 allocates about 100 GB of memory per GPU. OverSubscribe=YES allows more jobs than physical cores, useful for I/O-bound workloads.
Quality of Service Policies
QoS policies are where SLURM transforms from a simple job scheduler into an intelligent resource management system. I believe that QoS is something that needs to be discussed with the whole group and should not be set in stone. In our group, we consistently monitor SLURM usage and update our QoSs in order to maximize resource usage. The key insight: make the right thing to do also the easiest thing to do.
Initialize the Accounting System
Before creating QoS policies, initialize the accounting database:
# Create cluster and account (run once on controller)
sudo sacctmgr add cluster sardine-cluster
sudo sacctmgr add account sardine Description="Research Account" Organization=university
Note that the cluster name needs to match the one defined in /etc/slurm/slurm.conf.
QoS Design Philosophy
In our cluster, the QoS system creates a time-versus-priority trade-off. Short-running jobs get high priority and generous resource limits, encouraging users to break large experiments into smaller pieces. Long jobs get lower priority but extended time limits. Emergency QoS provides escape hatches for urgent deadlines. We also have specific QoSs granted on a per-user basis to control access to specific resources (e.g., H100s and H200s).
gpu-debug
Purpose: Quick testing, debugging, interactive development
Limits: 1 job, up to 8 GPUs, 1 hour max
Philosophy: Highest priority for rapid iteration
gpu-short
Purpose: Short experiments, hyperparameter sweeps, quick training
Limits: 2 jobs, up to 4 GPUs each, 4 hours max
Philosophy: High throughput for iterative research
gpu-medium
Purpose: Regular training runs, model development, evaluation
Limits: 1 job, up to 4 GPUs, 2 days max
Philosophy: Balanced resources for production work
gpu-long
Purpose: Extended training, large models, final experiments
Limits: 2 jobs, up to 2 GPUs each, 7 days max
Philosophy: Lower priority but extended time for big jobs
gpu-h100
Purpose: Only for people authorized to use H100s
Limits: 2 jobs, up to 4 GPUs each, unlimited time
Philosophy: Useful for large LLM training.
gpu-h200
Purpose: Only for people authorized to use H200s
Limits: 4 jobs, up to 4 GPUs each, unlimited time
Philosophy: Useful for even larger LLM training.
Creating QoS Policies
To add a QoS, use sacctmgr. Here is an example:
# Create QoS levels with carefully designed limits
sudo sacctmgr add qos cpu set priority=10 MaxJobsPerUser=4 \
    MaxTRESPerUser=cpu=32,mem=128G,gres/gpu=0

sudo sacctmgr add qos gpu-debug set priority=20 MaxJobsPerUser=1 \
    MaxTRESPerUser=gres/gpu=8 MaxWallDurationPerJob=01:00:00

sudo sacctmgr add qos gpu-short set priority=10 MaxJobsPerUser=2 \
    MaxTRESPerUser=gres/gpu=4 MaxWallDurationPerJob=04:00:00

sudo sacctmgr add qos gpu-medium set priority=5 MaxJobsPerUser=1 \
    MaxTRESPerUser=gres/gpu=4 MaxWallDurationPerJob=2-00:00:00

sudo sacctmgr add qos gpu-long set priority=2 MaxJobsPerUser=2 \
    MaxTRESPerUser=gres/gpu=2 MaxWallDurationPerJob=7-00:00:00

# Special QoS for H100/H200 nodes
sudo sacctmgr add qos gpu-h100 set priority=10 MaxJobsPerUser=2 \
    MaxTRESPerUser=gres/gpu=4 MaxWallDurationPerJob=2-00:00:00

sudo sacctmgr add qos gpu-h200 set priority=10 MaxJobsPerUser=4 \
    MaxTRESPerUser=gres/gpu=4 MaxWallDurationPerJob=4-00:00:00

# Emergency QoS for urgent situations / admins
sudo sacctmgr add qos gpu-hero set priority=100 MaxJobsPerUser=8 \
    MaxTRESPerUser=gres/gpu=8
Note that the math behind priority weighting matters. With PriorityWeightQOS=250000 and PriorityWeightAge=10000, QoS dominates priority calculations. A job with QoS priority 100 gets 25,000,000 priority points, while age contributes at most a few thousand points per day. This ensures urgent jobs run immediately while still allowing aging for fairness. See SLURM's priority multifactor documentation for the full math.
Then, add users and grant them access to appropriate QoS levels:
# Add users and grant QoS access
sudo sacctmgr create user --immediate name=alice account=sardine \
    QOS=cpu,gpu-debug,gpu-short,gpu-medium,gpu-long

sudo sacctmgr create user --immediate name=bob account=sardine \
    QOS=cpu,gpu-debug,gpu-short,gpu-medium,gpu-long,gpu-h100

# Verify user configuration
sudo sacctmgr show user alice -s
The parameter breakdown: Priority determines run order (higher runs first), MaxJobsPerUser limits concurrent jobs, MaxTRESPerUser caps total resources, and MaxWallDurationPerJob sets time limits. Users choose appropriate QoS based on their job requirements, creating natural load balancing.
Finally, restart services. Note that service startup order is critical for SLURM — starting services in the wrong order may lead to authentication failures and jobs that refuse to start:
# Enable
sudo systemctl enable slurmdbd
sudo systemctl enable slurmctld
sudo systemctl enable slurmd

# Restart (in this order on the controller!)
sudo systemctl restart slurmdbd
sudo systemctl restart slurmctld
sudo systemctl restart slurmd

# Check status
sudo systemctl status slurmdbd
sudo systemctl status slurmctld
sudo systemctl status slurmd
If something fails, check the logs in /var/log/slurm/slurmdbd.log, /var/log/slurm/slurmctld.log, and /var/log/slurm/slurmd.log for more information.
Advanced Monitoring and Analytics
Standard SLURM commands like squeue and sinfo are functional but provide a poor user experience. The output is hard to read, lacks crucial information like GPU allocations, and doesn't highlight relevant information for the current user. We can do much better.
Enhanced Queue Viewer: psqueue
I've developed enhanced replacements that provide beautiful tabular output, GPU allocation details, memory usage information, and user highlighting. The difference is quite dramatic.
Standard squeue shows basic information in a hard-to-read format:
JOBID PARTITION     NAME     USER ST       TIME  NODES NODELIST(REASON)
  123     a6000    train    alice  R       4:32      1 artemis
  124     a6000    eval     bob    PD      0:00      1 (Resources)
  125      h100    big    charlie  R  1-02:15:42    1 dionysus
Pretty squeue (psqueue) provides beautiful tables with GPU and memory information:
┏━━━━━━━┳━━━━━━━━━━━━━━━━┳━━━━━━━━━┳━━━━━━━━━━━━┳━━━━━━━━━━━━┳━━━━━━━━━━━━┳━━━━━━┳━━━━━━━━━━━━┳━━━━━━━━━━━━━┳━━━━━━━━━┳━━━━━━━━━━━━━━━━━━━━━┓
┃ JOBID ┃ NAME           ┃ USER    ┃ QOS        ┃ START_TIME ┃ TIME_LEFT  ┃ CPUS ┃ GPUS       ┃ MEMORY      ┃ STATE   ┃ NODELIST            ┃
┡━━━━━━━╇━━━━━━━━━━━━━━━━╇━━━━━━━━━╇━━━━━━━━━━━━╇━━━━━━━━━━━━╇━━━━━━━━━━━━╇━━━━━━╇━━━━━━━━━━━━╇━━━━━━━━━━━━━╇━━━━━━━━━╇━━━━━━━━━━━━━━━━━━━━━┩
│ 71020 │ python3        │ dony    │ gpu-medium │ 1-19:18:32 │ 2-00:00:00 │ 100  │ 4          │   0G (0%)   │ PENDING │ (Priority)          │
│ 71002 │ cv-judge       │ bob     │ gpu-long   │ -          │ 11:03:13   │ 8    │ 1 (ID 3)   │ 100G (100%) │ RUNNING │ artemis             │
│ 70916 │ mt-explanation │ miguel  │ gpu-h100   │ -          │ 5-05:18:51 │ 1    │ 2 (ID 5-6) │ 100G (50%)  │ RUNNING │ dionysus            │
│ 71101 │ qwen-coder     │ charlie │ gpu-h200   │ -          │ 3-23:39:10 │ 1    │ 1 (ID 3)   │ 168G (100%) │ RUNNING │ hades               │
│ 71076 │ llama-pretrain │ alice   │ gpu-h200   │ -          │ 21:52:01   │ 24   │ 2 (ID 4-5) │ 337G (100%) │ RUNNING │ hades               │
└───────┴────────────────┴─────────┴────────────┴────────────┴────────────┴──────┴────────────┴─────────────┴─────────┴─────────────────────┘
Standard sinfo is very simple:
PARTITION AVAIL  TIMELIMIT  NODES  STATE NODELIST
a6000        up   infinite      1    mix artemis
h100         up   infinite      1    mix dionysus
h200         up   infinite      1    mix hades
Pretty sinfo (psinfo) provides beautiful tables and more information:
┏━━━━━━━━━━┳━━━━━━━━━━━━━━━━━━┳━━━━━━━━━┳━━━━━━━━━━━━┳━━━━━━━━━━━━┳━━━━━━━━━━┳━━━━━━┳━━━━━━━┳━━━━━━━━━━━━━━━━┓
┃ NODE     ┃ GPUS_USED        ┃ GPUS    ┃ MEM_USED   ┃ MEMORY     ┃ CPU_LOAD ┃ CPUS ┃ STATE ┃ REASON         ┃
┡━━━━━━━━━━╇━━━━━━━━━━━━━━━━━━╇━━━━━━━━━╇━━━━━━━━━━━━╇━━━━━━━━━━━━╇━━━━━━━━━━╇━━━━━━╇━━━━━━━╇━━━━━━━━━━━━━━━━┩
│ artemis  │ 8 (ID 0-7)       │ a6000:8 │ 943.49 GB  │ 1007.52 GB │ 29.00%   │ 112  │ mixed │                │
│ dionysus │ 3 (ID 0-1,3)     │ h100:4  │ 951.34 GB  │ 1007.52 GB │ 5.81%    │ 112  │ mixed │                │
│ hades    │ 8 (ID 0-7)       │ h200:8  │ 1763.67 GB │ 2015.36 GB │ 4.82%    │ 192  │ mixed │                │
└──────────┴──────────────────┴─────────┴────────────┴────────────┴──────────┴──────┴───────┴────────────────┘
Installing Enhanced Tools
The tools are standalone Python packages that require the rich library, installable per-user via pip install --user rich.
You can find them in the GitHub repo:
Installing is just a matter of copying the scripts to /usr/local/bin:
sudo cp psqueue.py /usr/local/bin/psqueue
sudo chmod +x /usr/local/bin/psqueue
sudo cp psinfo.py /usr/local/bin/psinfo
sudo chmod +x /usr/local/bin/psinfo
The enhanced tools support all the same arguments as their SLURM counterparts:
# Enhanced queue display
psqueue

# Show only your jobs
psqueue --user=$USER

# Show only pending jobs with reasons
psqueue --states=PENDING

# Enhanced node information
psinfo

# Force ASCII output for scripts
psqueue --plain
psinfo --plain
Real-World Usage Examples
Here are some common examples that researchers actually use, from quick debugging sessions to large-scale training runs.
Interactive Development Workflows
Interactive sessions are crucial for research work — debugging code, testing models, and exploring datasets. The key is making these sessions fast to obtain (high priority) but limited in scope to prevent abuse. To launch an interactive session, pass --pty bash to srun:
Examples with srun
# Immediate access to 1 GPU for testing in artemis.
srun -p a6000 -w artemis --gres=gpu:1 --qos=gpu-debug --pty bash

# 4 hours with 4 A6000 GPUs in artemis.
srun -p a6000 -w artemis --gres=gpu:4 --qos=gpu-short --time=04:00:00 --pty bash

# Request specific H100 GPUs in the correct node (dionysus).
srun -p h100 -w dionysus --gres=gpu:h100:2 --qos=gpu-h100 --pty bash
Production Batch Jobs
Batch jobs are where SLURM really shines. A well-written job script includes proper resource requests, environment setup, logging, and error handling. Here's a complete example:
#!/bin/bash
# Complete SLURM batch script example

# === SLURM JOB PARAMETERS ===
# Slurm parameters are informed via the #SBATCH directive (yes, like a comment)

#SBATCH --job-name=bert-large-training
#SBATCH --gres=gpu:a6000:4              # 4 A6000 GPUs
#SBATCH --qos=gpu-medium                # Medium priority queue
#SBATCH --time=1-12:00:00               # 36 hours
#SBATCH --partition=a6000               # A6000 partition
#SBATCH --cpus-per-task=32              # 8 CPUs per GPU
#SBATCH --mem=100G                      # 25GB per GPU
#SBATCH --output=logs/training-%j.out   # %j = job ID
#SBATCH --error=logs/training-%j.err

# === ENVIRONMENT SETUP ===
# module load python/3.11.4 cuda/12.1.0
source /mnt/scratch/alice/envs/training/bin/activate

# === JOB INFO LOGGING ===
echo "Job started at: $(date)"
echo "Job ID: $SLURM_JOB_ID"
echo "Node: $SLURM_NODELIST"
echo "GPUs: $CUDA_VISIBLE_DEVICES"
echo "Working directory: $(pwd)"

# === ACTUAL TRAINING ===
cd /mnt/data/alice/bert-project

python -m torch.distributed.launch \
    --nproc_per_node=$SLURM_GPUS_ON_NODE \
    --nnodes=$SLURM_NNODES \
    --node_rank=$SLURM_PROCID \
    --master_addr=$SLURM_LAUNCH_NODE_IPADDR \
    --master_port=29500 \
    train.py \
        --config configs/bert-large.yaml \
        --output_dir checkpoints/bert-large-$(date +%Y%m%d) \
        --logging_dir logs/tensorboard-$SLURM_JOB_ID

echo "Job finished at: $(date)"
All we have to do is submit the job using sbatch:
sbatch training-job.sh
Your job will be given an ID by SLURM (e.g., 12345). At this point, you can monitor all jobs, including yours, using psqueue. The output of your job (stdout) will be saved in logs/training-12345.out.
Troubleshooting and Maintenance
Most problems fall into a few categories: hardware specification mismatches, authentication failures, resource conflicts, and performance bottlenecks.
Node in DRAIN State
This is by far the most common issue. When this happens, nodes appear as "drain", "drng", or "down" in psinfo output. This almost always indicates a mismatch between the hardware specifications in slurm.conf and the actual hardware SLURM detects on the node.
I recommend checking /etc/slurm/slurm.conf and making sure all Node values are correct, according to what you obtain with free -m and sudo slurmd -C.
The simplest solution is to try the following command, which sets a specific node back to the RESUME state:
sudo scontrol update NodeName=nodename State=RESUME
If that doesn't work, check logs via sudo journalctl -u slurmd --since "1 hour ago" or directly in /var/log/slurm/*.
Jobs Stuck PENDING
The enhanced queue viewer makes diagnosing pending jobs much easier by showing detailed reasons:
# See detailed pending reasons
psqueue --states=PENDING
Common pending reasons and their meanings:
- Priority: Higher priority jobs waiting → normal, will run eventually
- Resources: Not enough free GPUs/memory → wait or reduce request
- QOSMaxGRESPerUser: User exceeded GPU limit → wait for jobs to finish
- BadConstraints: Invalid resource request → fix job parameters
- PartitionNodeLimit: Partition full → try different partition
Interactive HTML Reports
Production clusters generate vast amounts of usage data that can provide insights into user behavior, resource efficiency, and policy effectiveness. Automated reporting transforms this raw data into actionable insights for capacity planning and optimization.
How to decide the characteristics of each QoS? How to know if the server is idle and too many jobs are just stuck in the queue? SLURM provides a vast amount of usage data via sacct, but all that data comes in a format that is almost impossible to read. Therefore, I decided to create a script that transforms that raw data into actionable insights.
The cluster-scope script generates comprehensive HTML reports with interactive charts and analytics. These reports help identify usage patterns, efficiency metrics, and optimization opportunities. Report features include interactive visualizations (job state distribution, timeline analysis), resource utilization by user/QoS, queue performance metrics, efficiency rates, and capacity planning recommendations based on actual usage patterns.
# Install dependencies
pip install pandas matplotlib numpy seaborn jinja2

# Generate comprehensive report
sudo python3 slurm_report.py --start-date 2025-01-01
That's all!
Conclusion
This guide has taken you from basic concepts to a fully operational, production-ready SLURM cluster with advanced monitoring, analytics, and optimization features. What started as a solution to our lab's spreadsheet chaos has become a robust system that fairly allocates resources, encourages efficient usage patterns, and provides valuable insights into research computing patterns.
You now have a production-ready SLURM cluster with sophisticated QoS policies, beautiful monitoring tools, automated reporting, and optimization features that rival commercial HPC installations 🚀
What's next?
A cluster is only as good as its management. Regular monitoring, user feedback, and continuous optimization will ensure your SLURM deployment remains effective and valuable for your research community. I strongly believe that the time invested in proper setup pays off in research productivity, fair resource access, and reduced administrative overhead (trust me, life is so much better with SLURM).
In that spirit, there are many more things you'll need to set up for a seamless experience:
-
Shared filesystem: In our clusters, we use GlusterFS as the shared filesystem for
homedirectories, so that all users have a unique home folder regardless of which server they log in to. -
NFS mountpoints: I strongly suggest dividing disks into three categories:
home(small disks, RAID 1) for code and scripts,data(large disks, RAID 5/6) for important large files, andscratch(large disks, RAID 0) for datasets and model checkpoints. We use NFS fordataandscratchso they're accessible from all servers. - Quota: Without quota, people will download data and generate checkpoints up to the disk limit. A quota system helps maintain fair use of disk space.
-
Spack and LMOD: Having the option to start a project with the correct version of Python, CUDA, or other libraries is very important. The combination of Spack and LMOD is great for this — just do
module load python/3.13and go.
All configuration files, scripts, and tools mentioned in this guide are available in the accompanying GitHub repository. I have also created the following additional resources:
- For users: Quickstart guide for launching & managing jobs
- For admins: Cluster management & QoS setup notes
Both are living docs. Feel free to send PRs or comments if you have improvements!
Acknowledgments: Special thanks to the true SARDINE warriors, Duarte Alves and Sweta Agrawal, whose patience, expertise, and funny debugging sessions made this SLURM guide possible 🙏
Comments